Power Reporting: Advance Booking Days

The Advance Booking Days report is separated into different sections. First, a graph that can be seen in line or bar chart format, followed by a summary of the Advance Booking Days for the current and previous time periods. This is then followed by breakout of the advance booking days by rental.
Advance Booking Days Graph
If you are looking to know how much time in advance your guests are confirming their reservations, this is an interesting graph to analyze, to know how many days before arrival your customers plan and make the reservation for your Rentals.
What is being calculated is: the gap (in days) between the day each reservation is confirmed and the day of arrival of each booking, plotted by reservation day. To illustrate, if for a given month the value is around 60 days, this means that within that month, your customers made reservations where the arrival day, on average, is about 2 months later.
The main number shown in the upper left side of the graph and in the Control Center general View shows the main value within the selected period and Rentals.

The graph allows you to change the way it is displayed, as well as allowing different export options.
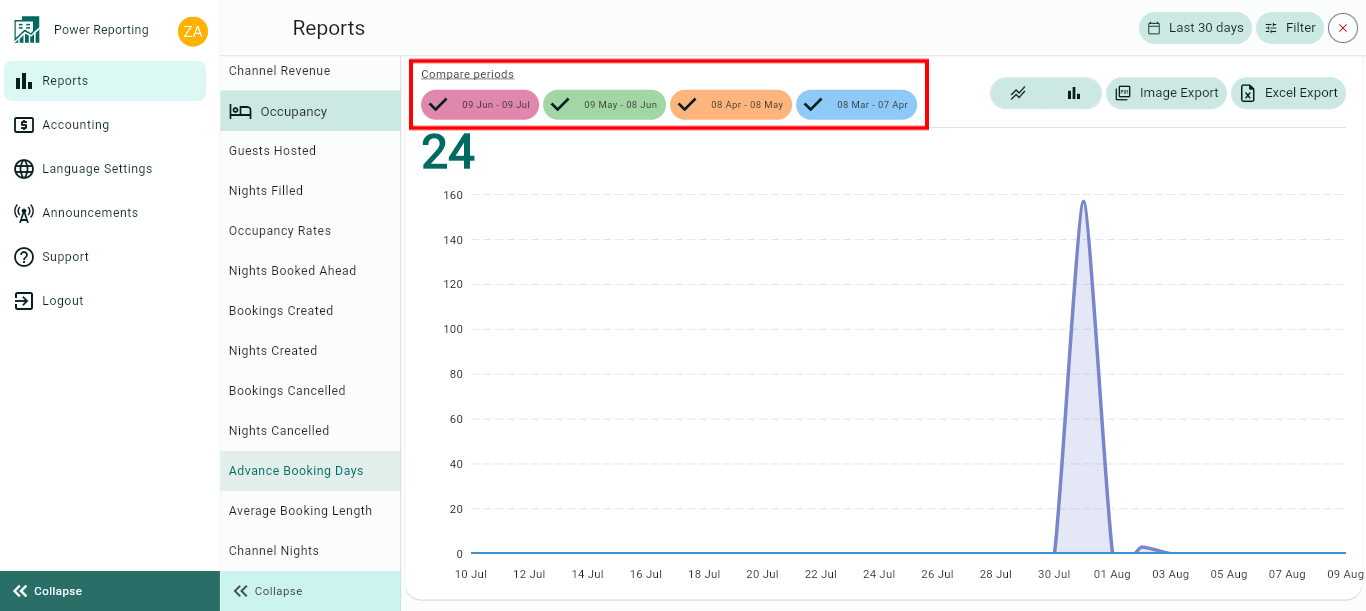
Compare Periods:
This option allows you to select different periods and have them displayed on the graph alongside your selected filter period. With this option, you can easily compare values from the different periods.
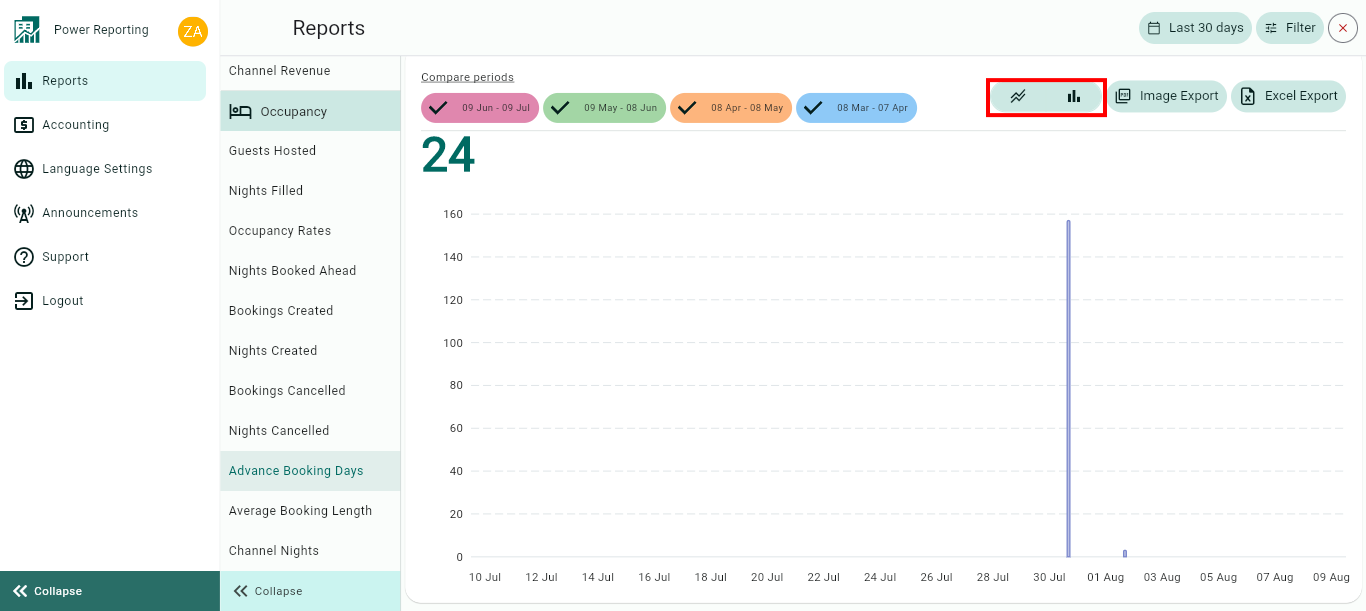
Graph type:
The default graph type that will be displayed is a line graph. You can also click on the bar chart icon to view the graph in that format instead.
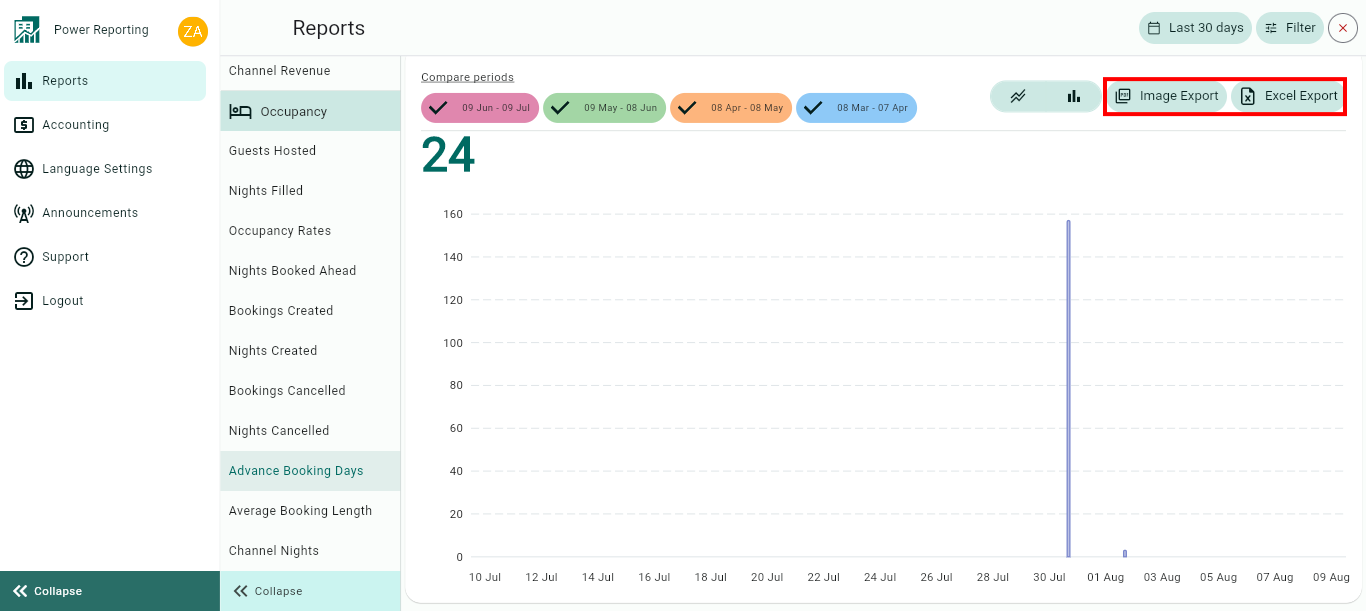
Export options:
Above the graph, you will also find the option to export it in an image or Excel format.
Advance Booking Days Totals
This area shows the Advance Booking Days for your selected filter period and the previous periods so you can view a quick comparison.
E.g. if your filter is set to show the last 30 days, then each period here will be for 30 days. If you selected the last quarter, then each period will be for the last quarter and the 4 before that.

Breakouts by Time Periods
The time period selected in your filter will also have a more detailed breakout where you can get figures for each period. Using the scrollbar below will allow you to see all of the information available.
