Power Reporting: Channel Revenue Report

The Channel Revenue report is separated into different sections. First, a graph that can be seen in line or bar chart format, followed by a summary of the Channel Revenue for the current and previous time periods. This is then followed by breakouts, filtered by channel.
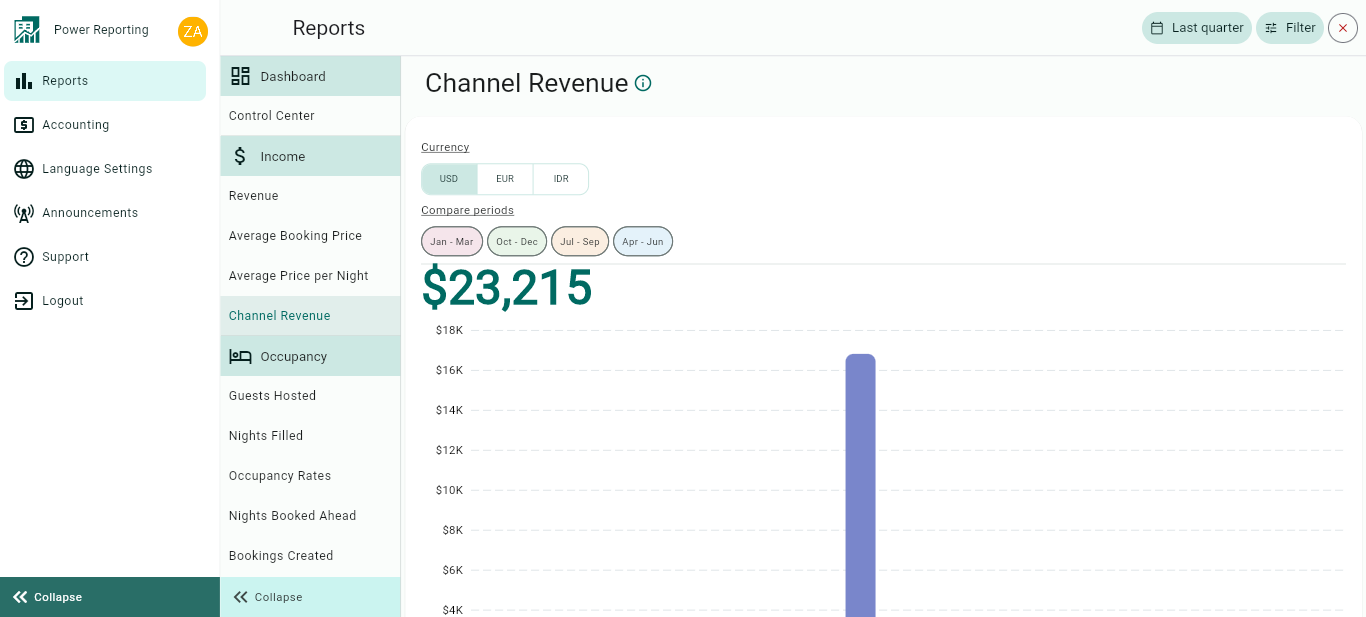
Channel Revenue Graph
This graph shows the revenue you get from each of your booking sources. The reference date taken into consideration, in this case, is the arrival day.
The graph allows you to change the way it is displayed, see below.
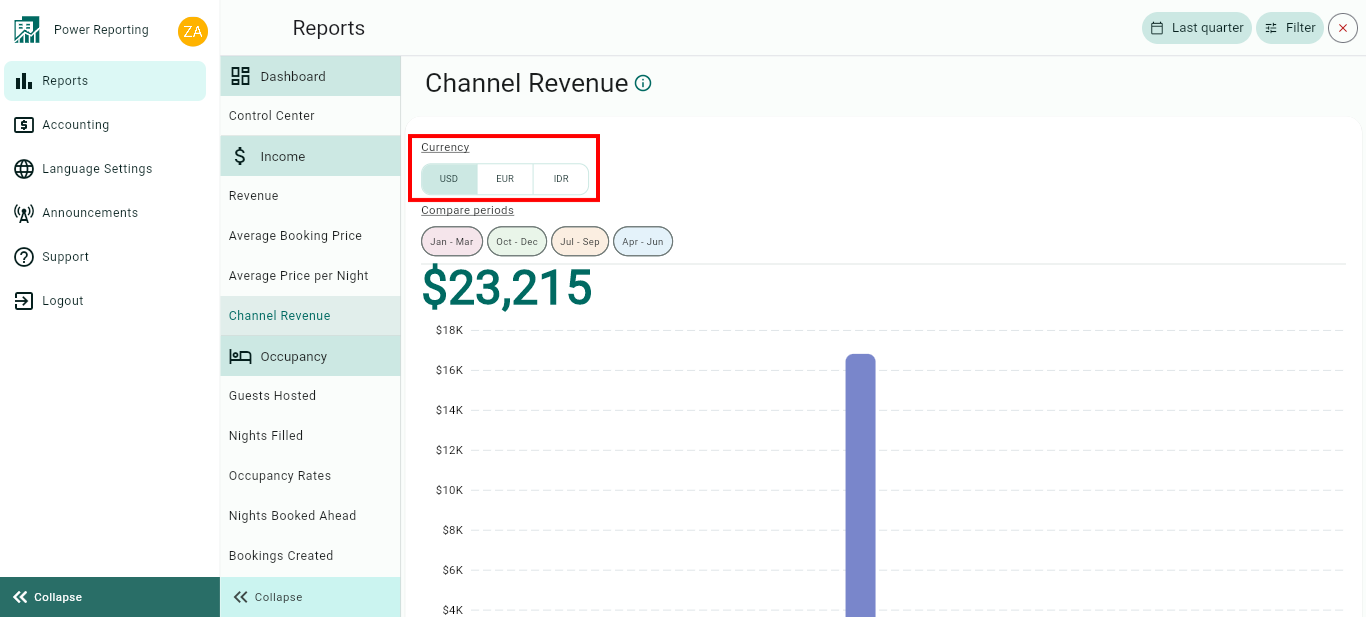
Currency:
You can easily change the currency at the top of the page.
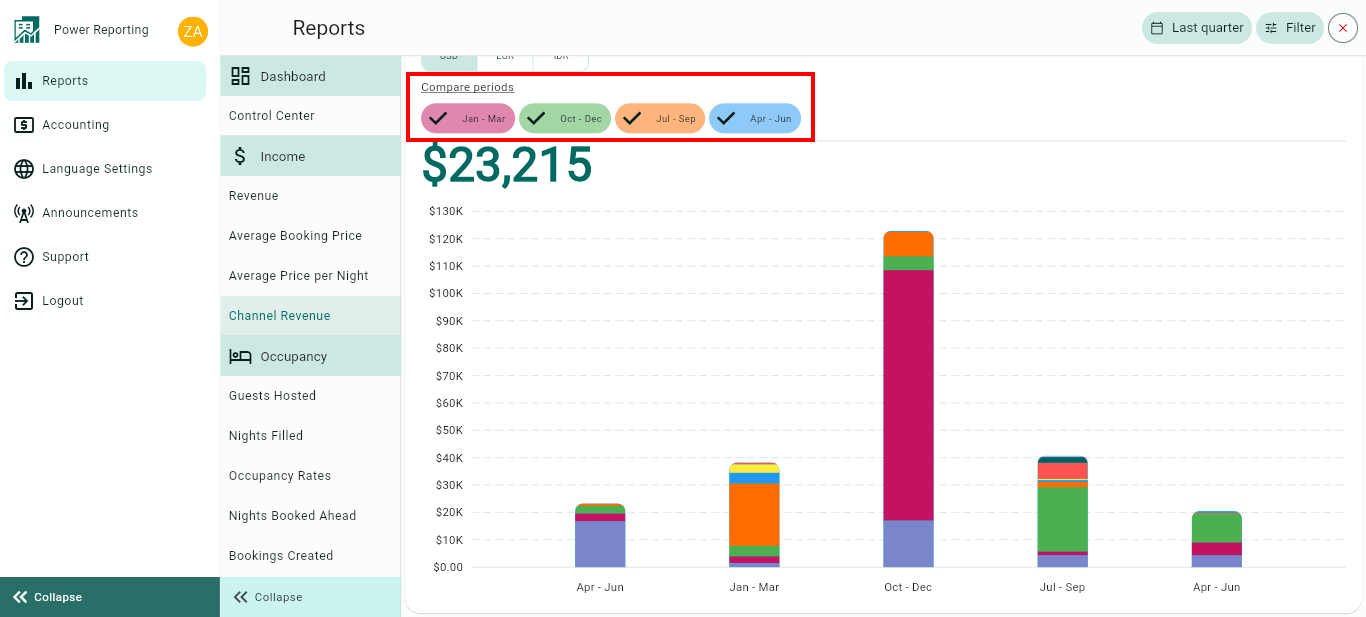
Compare Periods:
This option allows you to select different periods and have them displayed on the graph alongside your selected filter period. With this option, you can easily compare values from the different periods.
Channel Revenue Totals
This area shows the Channel Revenue for your selected filter period and the previous periods so you can view a quick comparison.
E.g. if your filter is set to show the last 30 days, then each period here will be for 30 days. If you selected the last quarter, then each period will be for the last quarter and the 4 before that.
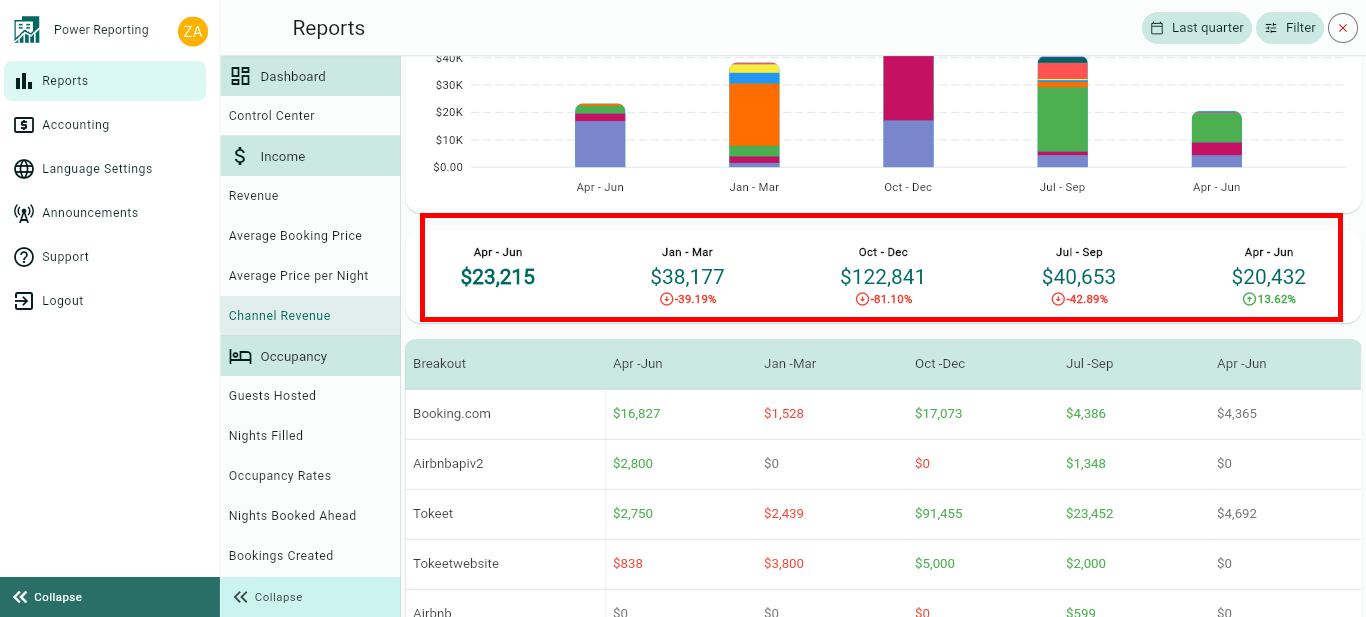
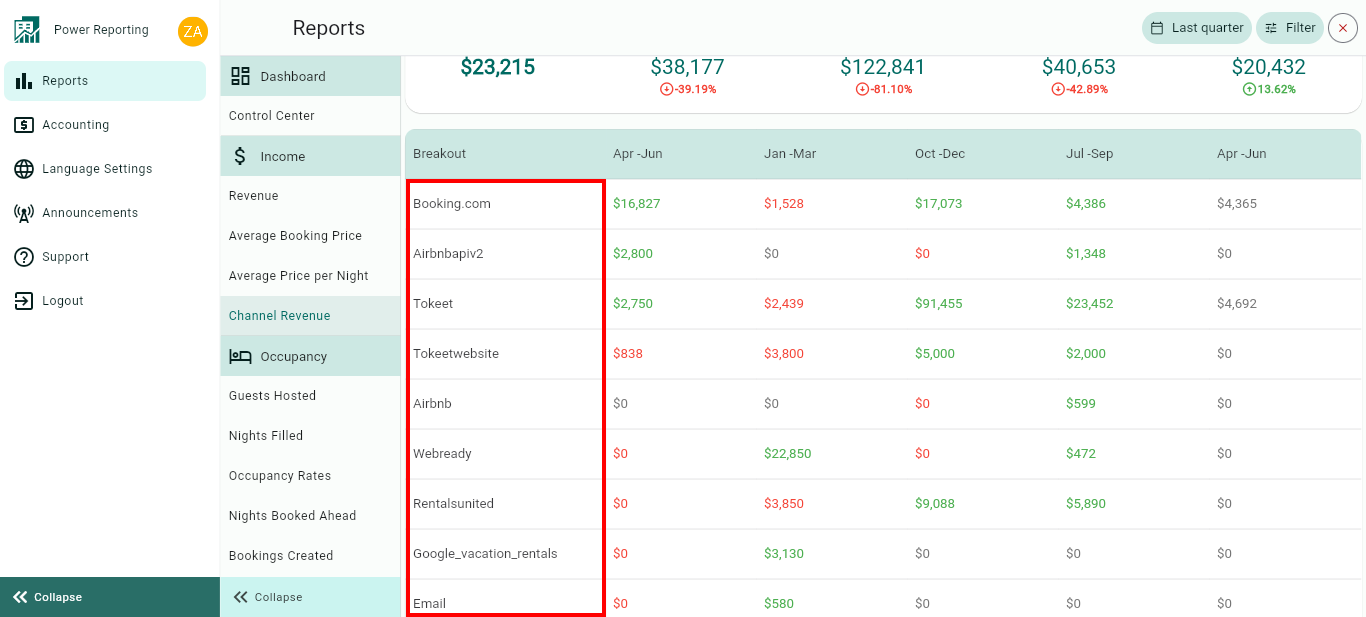
Breakouts by Channels
The time period selected in your filter will also have a more detailed breakout where you can get figures for each channel.