Margins - Monthly Revenue

In the Monthly Revenue section under Revenue, you'll be presented with information on the total revenue for the each month.
This is broken down into a Revenue Chart, Night Booked Chart and Monthly Revenue Summary.
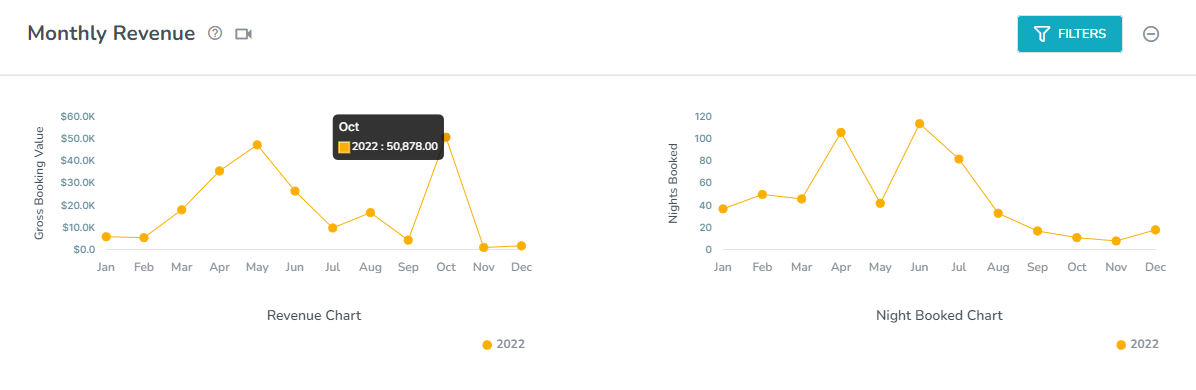
Revenue Chart - this shows the distribution of revenue across the months.
Night Booked Chart - this shows the distribution of nights booked across the months.
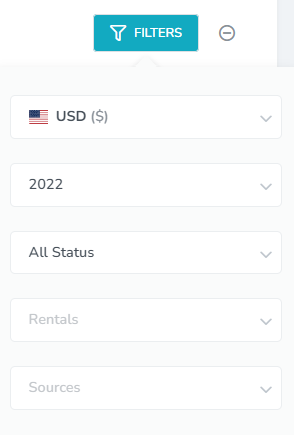
The Filters button above allows you to only view information based on the currency, year, booking status, rentals and sources.
The Monthly Revenue Summary shows a breakdown of your revenue each month based on the fields below.
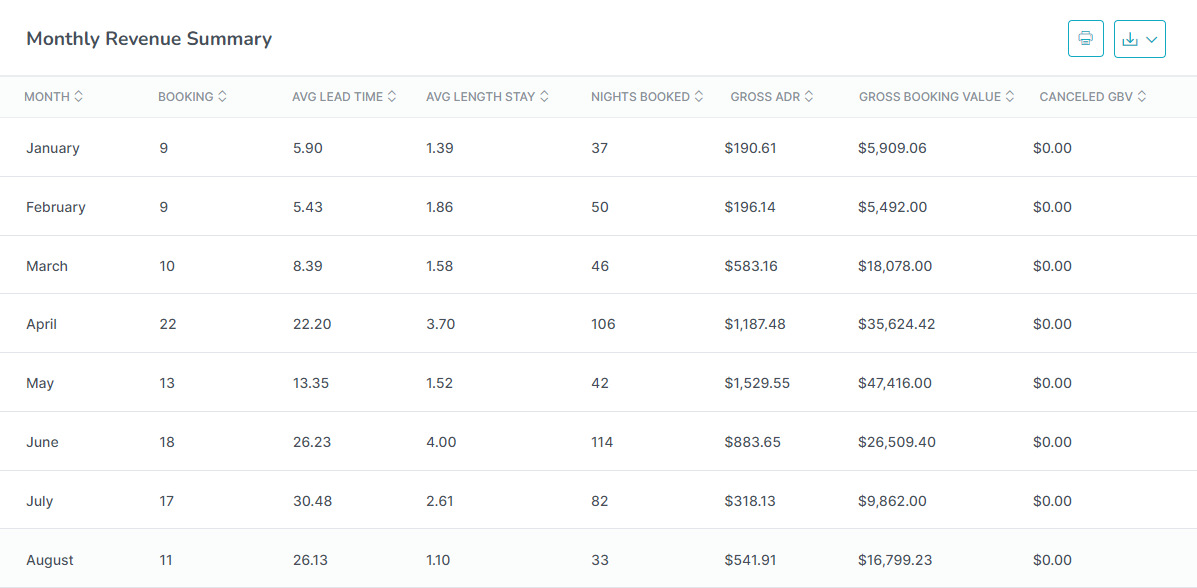
Bookings: No. of bookings
Avg lead time: Total lead count in month/number of days in the month
Avg stay length: Total booking days/number of days in the month
Nights booked: Total distinct occupied nights
Gross ADR (Average Daily Rate): Total Gross Revenue/number of days in the month
Gross booking value (GBV): Total Gross Revenue of bookings
Canceled GBV: Total Gross Revenue of canceled bookings
See more terminology here:
Lead : Difference in days between booking date and guest arrival date
Booking days: Difference in days between guest arrive and guest depart dates
ADR: The average rental Revenue earned for an occupied rental per day