Margins - Dashboard

With the new Dashboard in Margins, you can quickly view all of the important information related to your bookings.
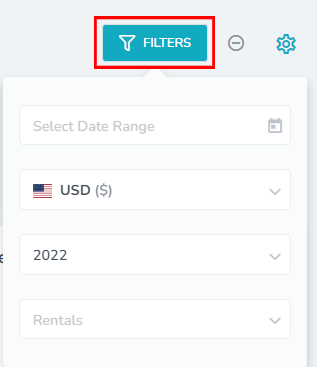
You will be able to control the information displayed on the dashboard by using the filter button and choosing the date range, currency, year or rentals.
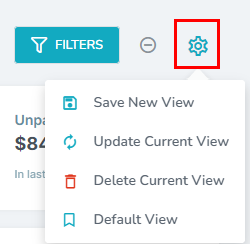
There is also the option to adjust the view on the page by clicking on the settings icon. Views are a quick and easy way to save your dashboard and report configurations. You can then go back to your previous configuration, or switch configurations, in one click.
Here you can set the page to always display with your current filters and select the charts that you will like to see when you view the page.
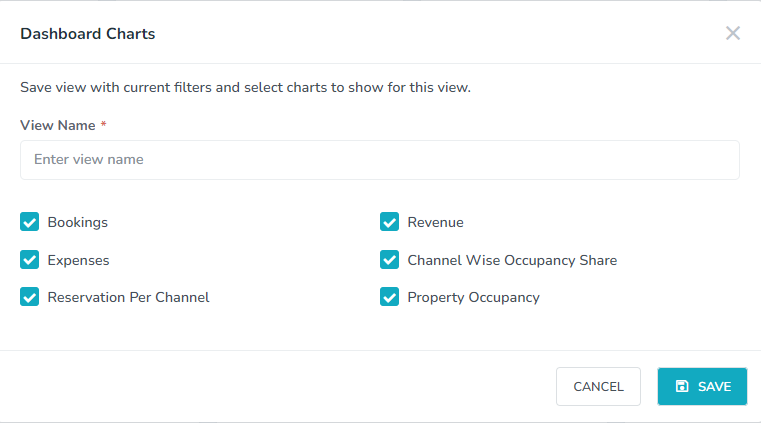
You'll be able to save a new view, update or delete your current view or set the view to your default view.
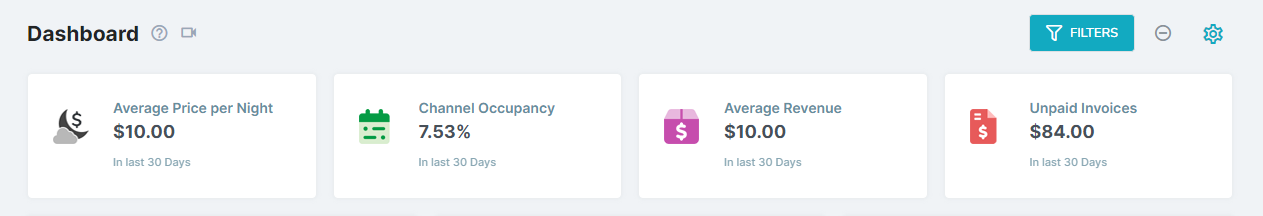
The information is provided to you with 4 top cards for the following:
Average Price per Night - Gross charge of last 30 days bookings/30
bookings = bookings of last 30 days
total = Sum of (bookings.charge/bookings.nights)
avgPricePerNight = total/30
Channel Occupancy - The total percentage of channel occupancy within the past 30 days
Average Revenue - The average revenue of bookings within the past 30 days
Unpaid Invoices - The total of all unpaid invoices sent within the past 30 days
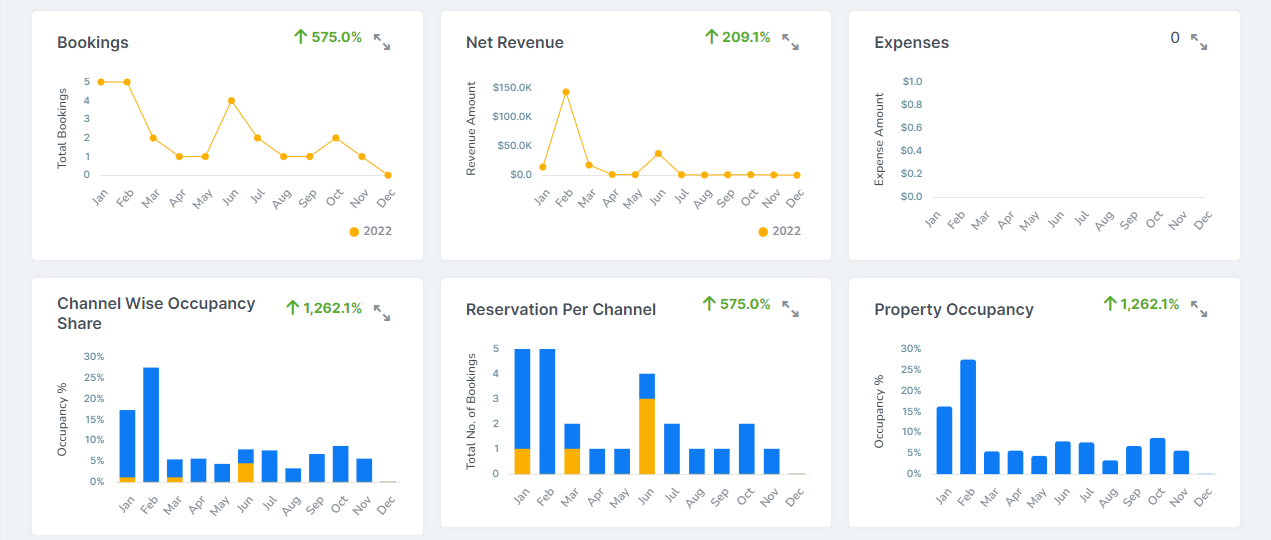
You will also see charts to give a visual representation of the information below:
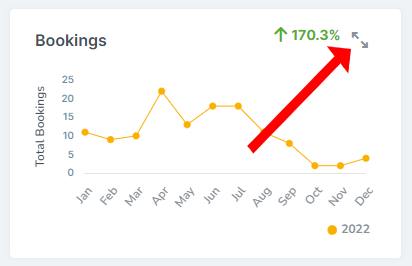
Bookings - This graph shows the total of bookings month-wise over a span of one selected year.
Trend: This shows the % difference between selected year bookings with last year.
Revenue - This graph shows the total booking revenue month-wise over a span of one selected year.
Trend: This shows the % difference between selected year bookings revenue with last year.
Expenses - This graph shows the total expenses month-wise over a span of one selected year.
Trend: This shows the % difference between the selected year's total expenses with last year.
Channel Wise Occupancy Share - This graph shows the total booking occupancy per channel (differentiated by different colors) month-wise over a span of one selected year.
Trend: This shows the % difference between the selected year's booking occupancy with last year.
Reservation Per Channel - This graph shows the total no. of bookings per channel (differentiated by different colors) month-wise over a span of one selected year.
Trend: This shows the % difference between the selected year's bookings per channel with last year.
Property Occupancy - This graph shows the total no. of property occupancy % month-wise over a span of one selected year differentiating the rentals w.r.t. colors on the bar.
Trend: This shows the % difference between the selected year's property occupancy with last year.
You can also expand each chat by clicking on the arrows in the top right corner of the chart to view a larger version of the chart.