Margins - Overview

Margins is Tokeet’s very own data center, allowing users to receive actionable insights and performance reports for their VR business. There’s no shortage of data collection points, and thanks to some smart visualization options, you will have everything you need to accelerate past your closest competitors with ease.
Once logged in, you will get to the Dashboard page.
Dashboard
You will be able to control the information displayed on the dashboard by using the Filters button and choosing the date range, currency, year or rentals.
There is also the option to adjust the view on the page by clicking on the settings icon. Read more on Views here.
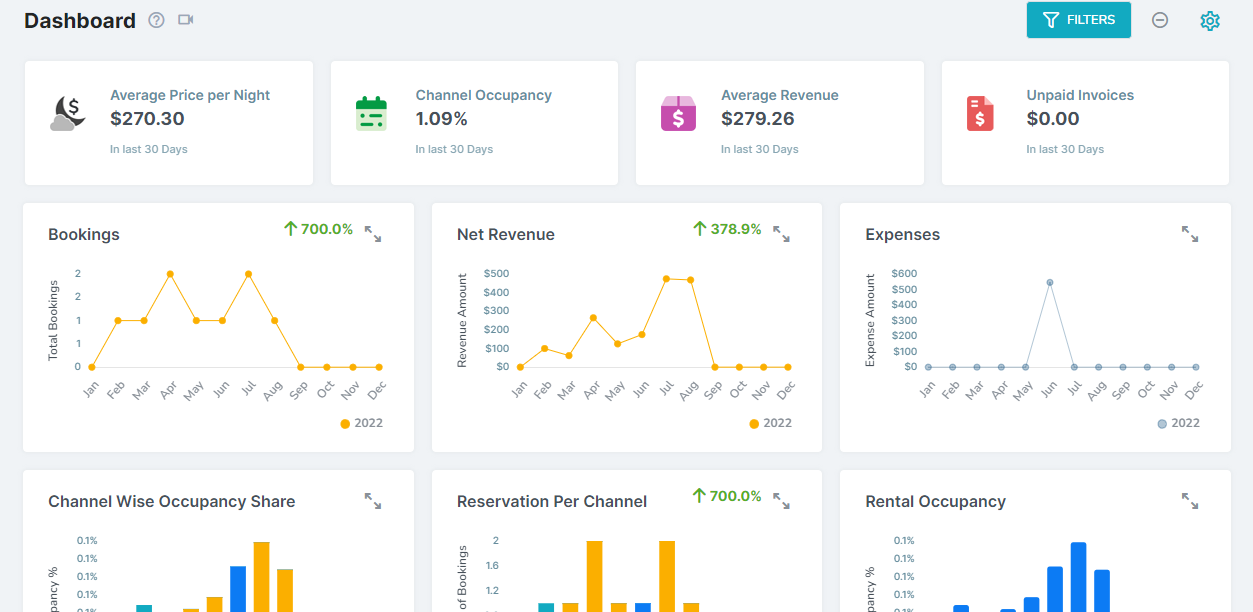
On the Dashboard page, you will be able to see a summary of data based on the last 30 days along with graphs representing a snapshot of your account.
30 day summaries:
- Average Price per Night
- Channel Occupancy
- Average Revenue
- Unpaid Invoices
Charts include those showing information for:
- Bookings
- Net Revenue
- Expenses
- Channel Wise Occupancy Share
- Reservation Per Channel
- Rental Occupancy
Click here to view a detailed article on the Dashboard.
Revenue
The revenue section in Margins is broken into the following areas:
Earnings - see your monthly earnings broken down by channel.
Monthly Financials - view a graph showing the total monthly revenue, as well as a table showing how the finances were distributed each month.
Daily Financials - get information on the daily financials for the current month such as daily revenue, occupancy % and revenue per guest.
Invoices - view your monthly invoice totals and invoice list.
Monthly Revenue - see information on the total revenue for the each month.
Monthly Rates - get information on the average daily rate and year over year (YoY) values relating to your monthly revenue.
Profit & Loss - see your revenue, expense and net income.
Expenses
The expenses section in Margins is broken into 3 areas:
Expenses - view, add and manage your monthly expenses.
Monthly Taxes - see a graph showing the total taxes per month, as well as a monthly tax summary.
Discount Codes - view a graph showing the total discount codes per month, as well as a breakdown of each discount code.
Bookings
The bookings section in Margins is broken into the areas below:
Monthly Bookings - get information on the total bookings for the each month.
Bookings Summary - see the distribution of inquiries based on the inquiry status (booked, not booked or canceled).
Canceled Bookings - view the total number of canceled bookings for each month.
Daily Occupancy - get your daily booking count for the current month.
Monthly Occupancy - see the occupancy % for each month.
Monthly Channel Occupancy - view your monthly distribution of inquiries broken down by channel.
Departures - see the total number of check-outs for each day in the month.
Arrivals - get the total number of check-ins for each day in the month.
Booking Fees - view the breakdown of all booking fees by name, along with totals, for each month.
Formulas
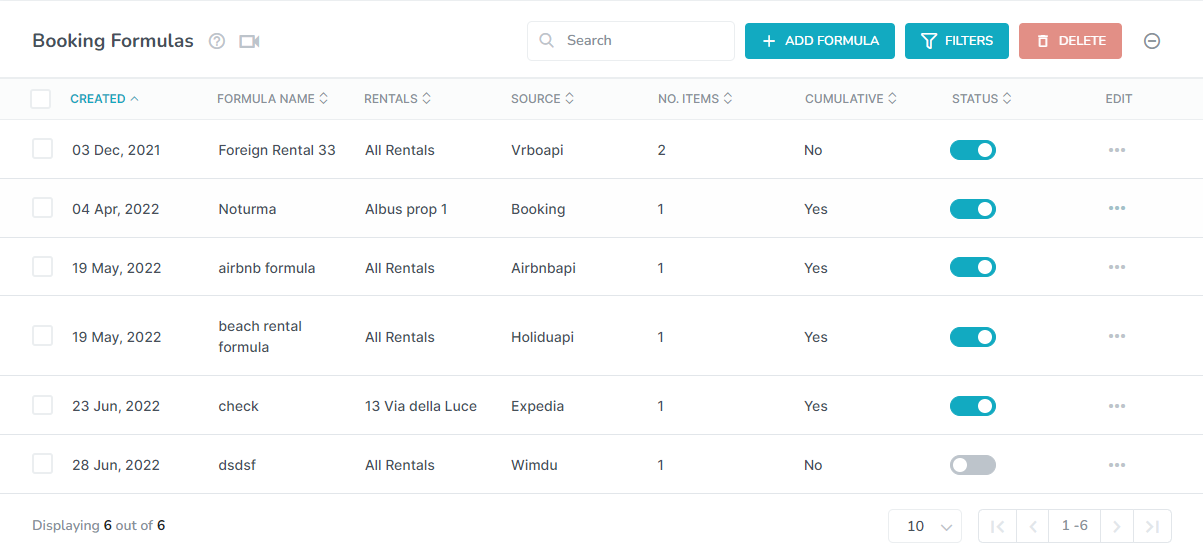
This section of Margins allows you to create booking formulas for your channels. This is useful as there may be booking price discrepancies between what is shown on the booking channel compared to what the channel sends over to the channel manager.
This may be because of any of the following reasons:
- The currency is not the same on Tokeet and your channel(s).
- The channels do not include the cleaning fee, service charges and local taxes when the data is sent to Tokeet.
- The price shown is the amount that the channel charges a commission on.
In the formulas section, you will be able to create and manage your booking formulas. For detailed information on this, please see this article.