Margins - Profit & Loss

The Profit & Loss Report allows you to see your revenue, expense and net income.
At the top of the page, you will see a Filters button allowing you to choose what you'll like to see in the different sections below.
You can filter by revenue type, date range, currency, year, booking status, rentals and sources.
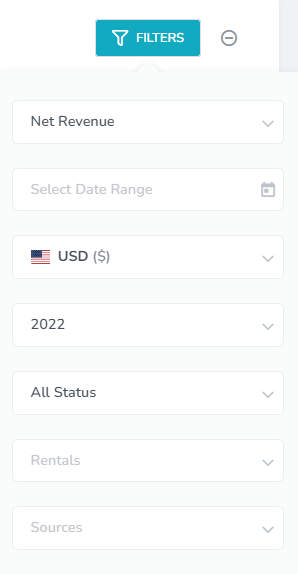
There are 3 types of Revenue Types to choose from in the Filters window:
Top Line Revenue: Gross revenue by bookings (Expense will be 0)
Formula Based Revenue: Revenue calculated by booking formula (Expense will be 0)
Net Revenue: Net revenue sum by bookings (Expense will be the expense amount)
Terminology:
Gross: Only the booking charges
Net: Booking charges + additional guest fee + deductions like discount + taxes etc
The first section gives a total of your revenue and expense and the calculate net income.
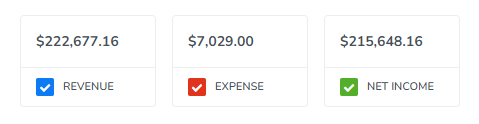
You can deselect the checkbox for Revenue or Expense to exclude them from the totals and chart below.
Next, you'll find your profit & loss chart which shows your revenue, expense and net income for each month when you hover over the columns.
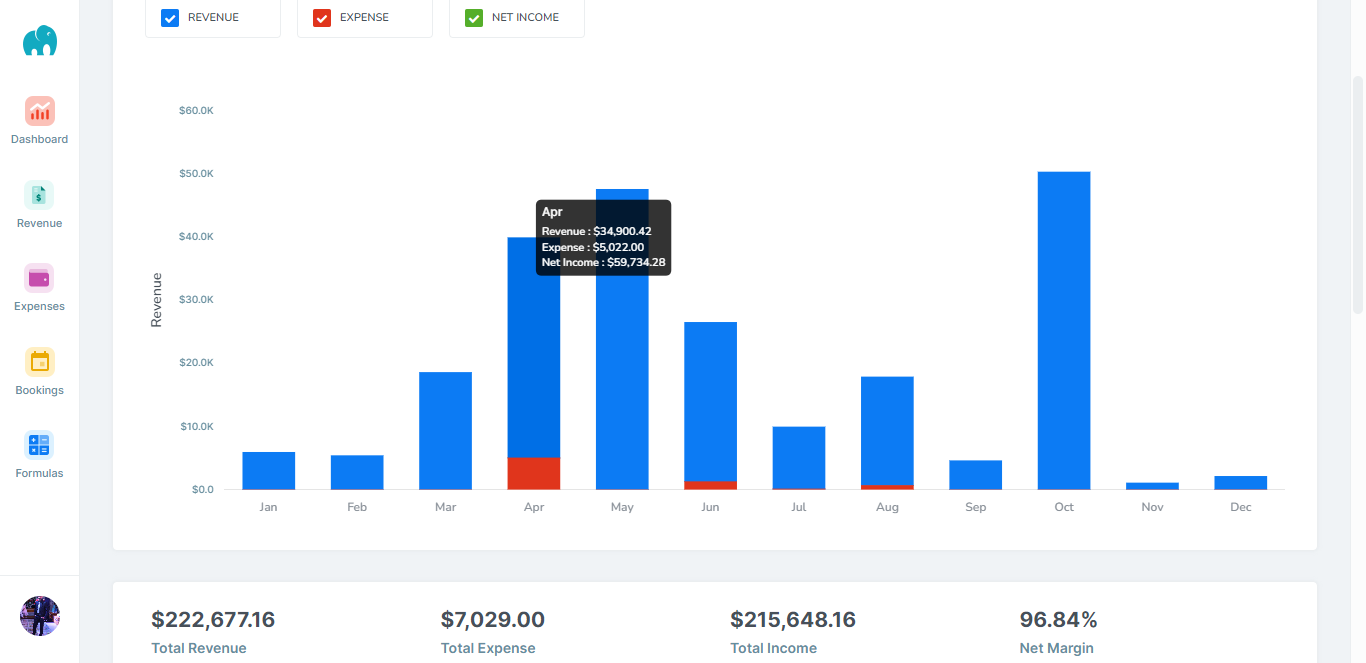
This is followed by a summary of your total revenue, total expense, total income and net margin.

Total Revenue: Net revenue for the year
Total Expense: Net expense for the year
Total Income: Net revenue for the year
Net Margin: Net Margin % = (Total Booking Revenue - Total Expense Revenue) / Total Booking Revenue * 100
Profit & Loss Summary
Here you will see a table showing the total revenue, expense and net revenue for each month.
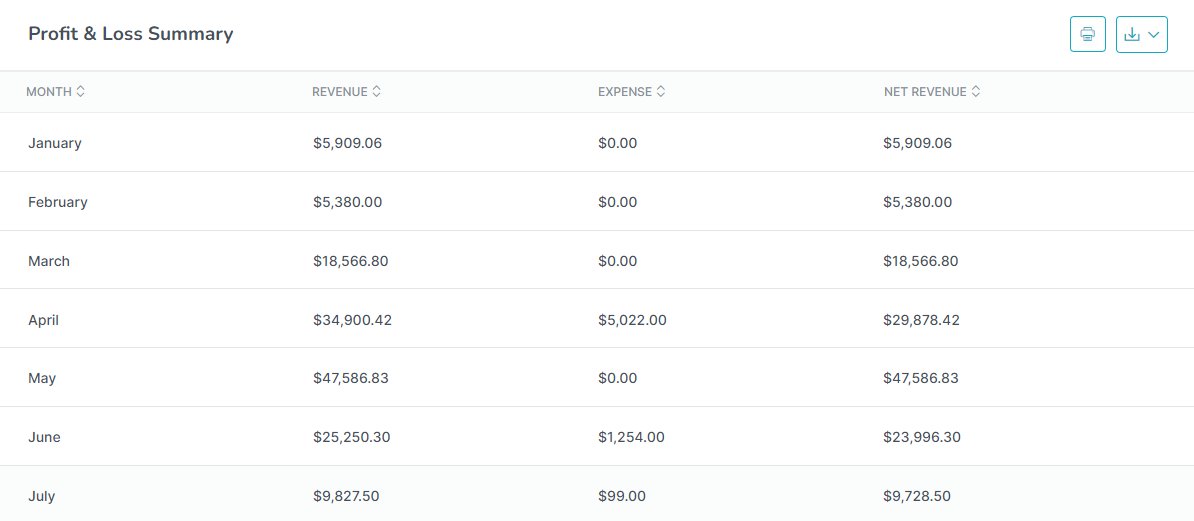
You can also print or download the information as CSV or Excel using the available icons.