
Now that 2019 is rolling along without major incident, perhaps it’s time to assess the industry’s foothold again. The vacation rental industry is still new, and its growth has been meteoric to say the least – but is it liable to taper off any time soon?
With any new industry, there’s a certain amount of volatility expected. And with the threat of regulations looming over some regions, it’s only natural to feel a little uncertain. That being said, the yearly projections for the VR industry are still looking rock solid.
Vacation Rental Industry Performance Projections
Before we take a look at overall VR/OTA/Hotel performance, let’s focus on the vacation rental industry itself. Below are various projections based on current and past performance up to the year 2023. All currency-related metrics are in USD.
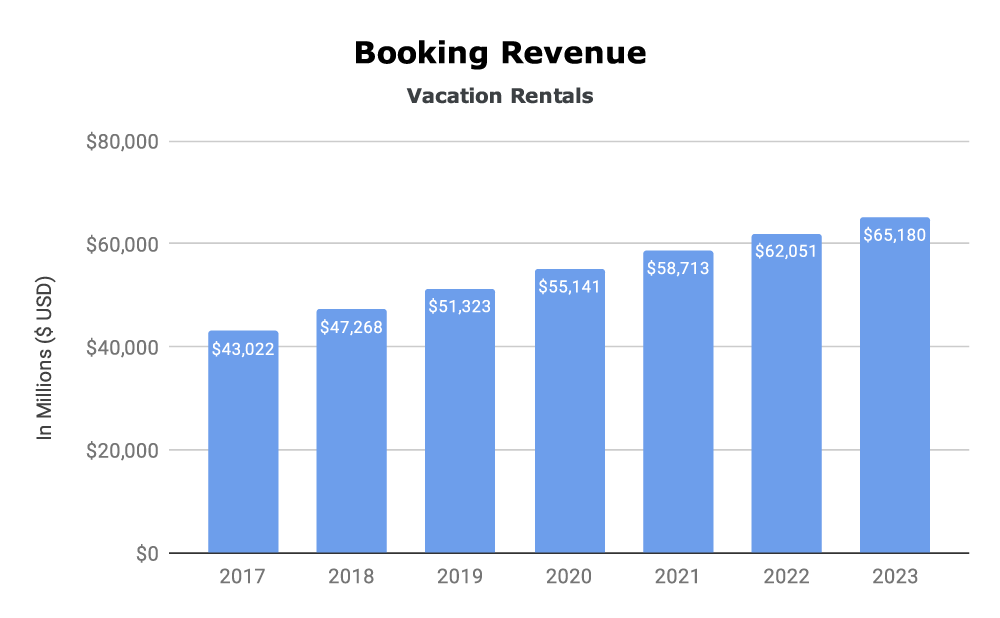
Revenue (Vacation Rentals)
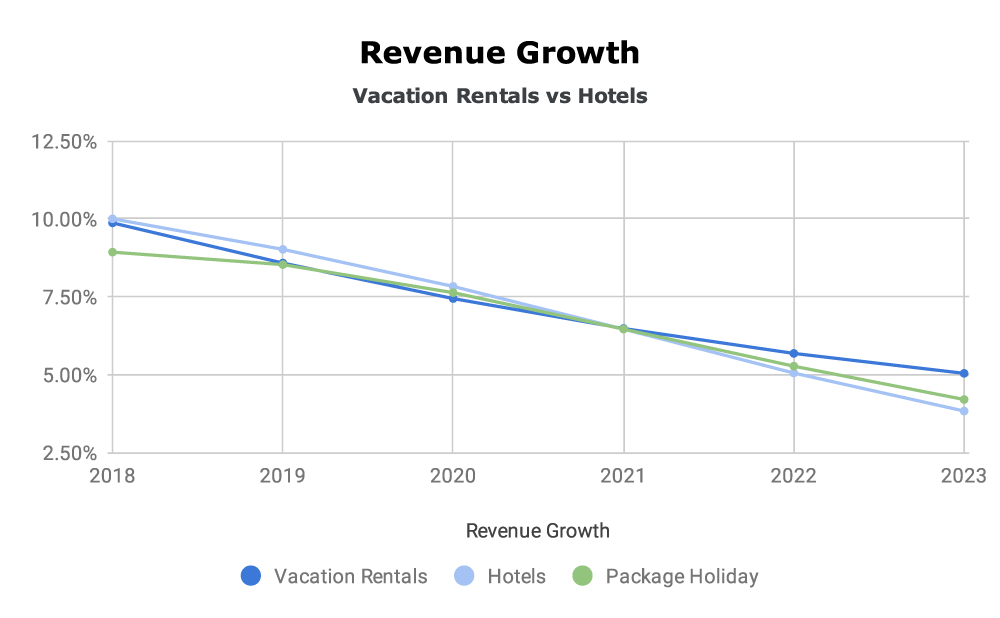
The growth of the vacation rental market up until recently could be described as ‘explosive’. Past years have seen as much as 25 – 38% in growth. But, drawing from the statistics below, it looks like the market is starting to level.
Still, there’s an enormous amount of growth to come. The projections show a 3 to 4 billion dollar increase every year for the next five years. While the initial explosive growth may be leveling, we’re still left with a very healthy industry.
The downward growth percentage trends give a false impression of shrinking revenue. This is due to the additional amounts being added to the total percentage each year. In actuality, the yearly growth is occurring very close to a steady rate.
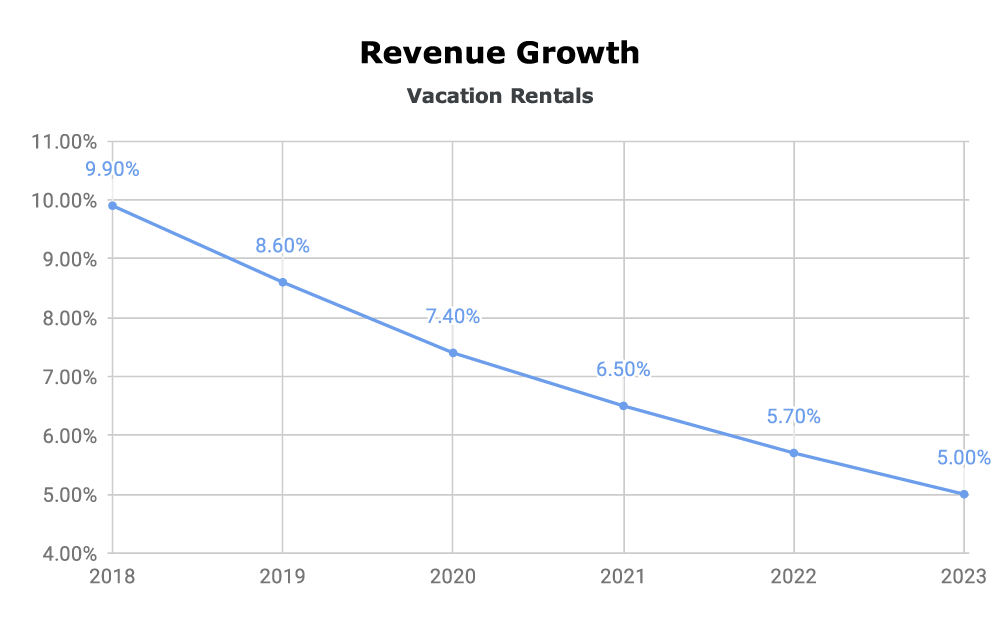
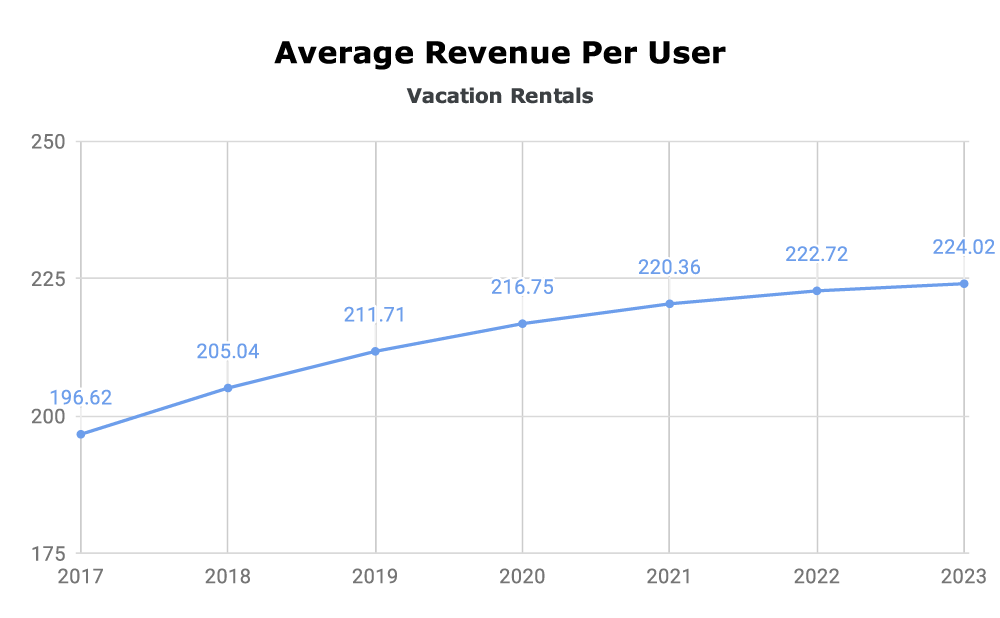
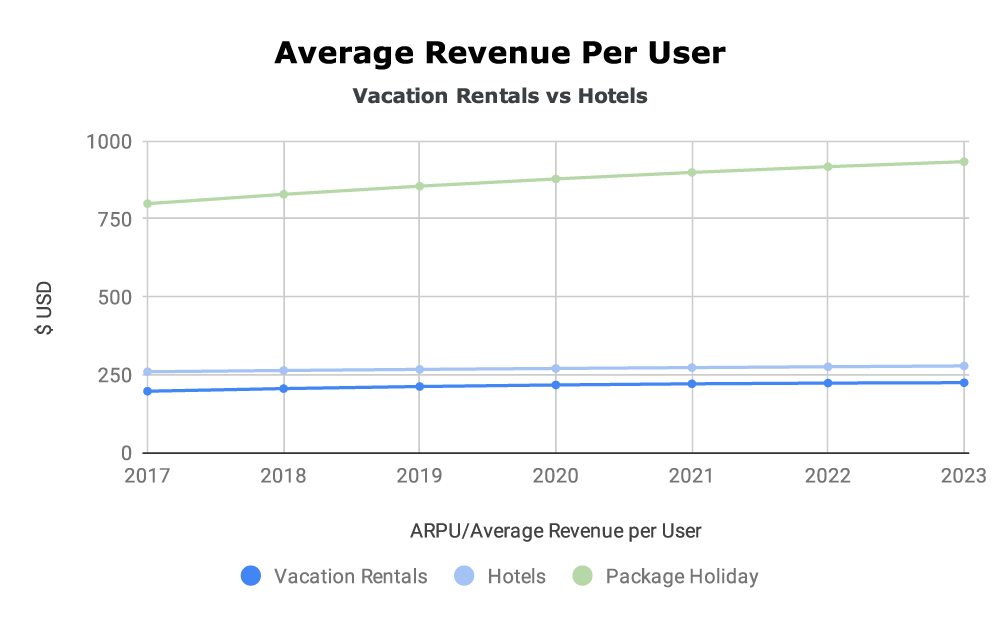
The average revenue per user is measured in USD. Here we also see a steadying increase, but the projected user growth base is also factored into this. This projection is more indicative of user growth than user behavior (see User data below).
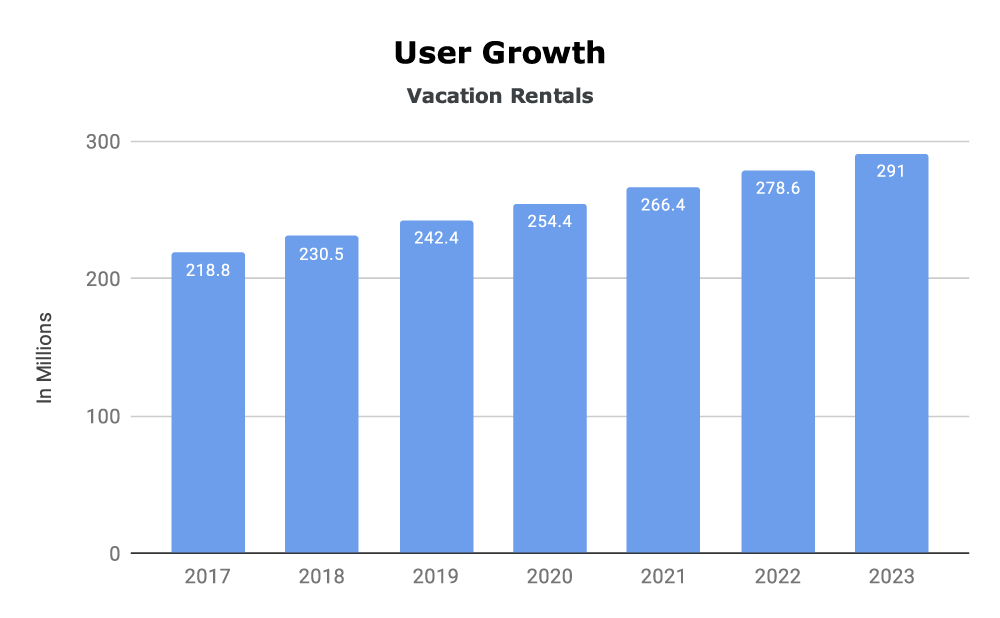
Users (Vacation Rentals)
The user growth for the vacation industry follows the same trend as the revenue growth. Understandably so, since the two are inextricably linked. The numerical count of new users is fairly even year by year (~12 million).
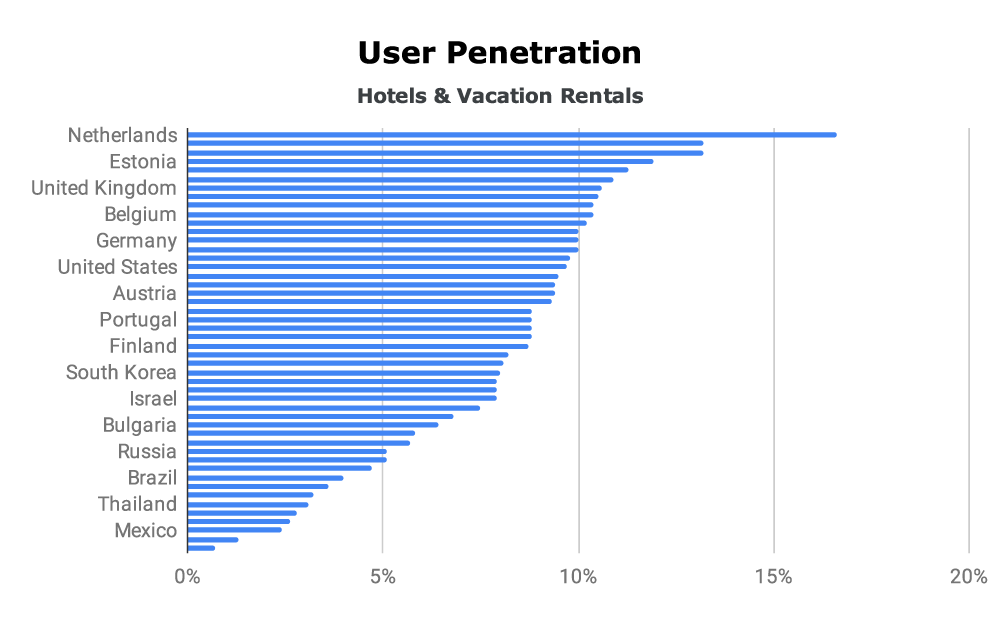
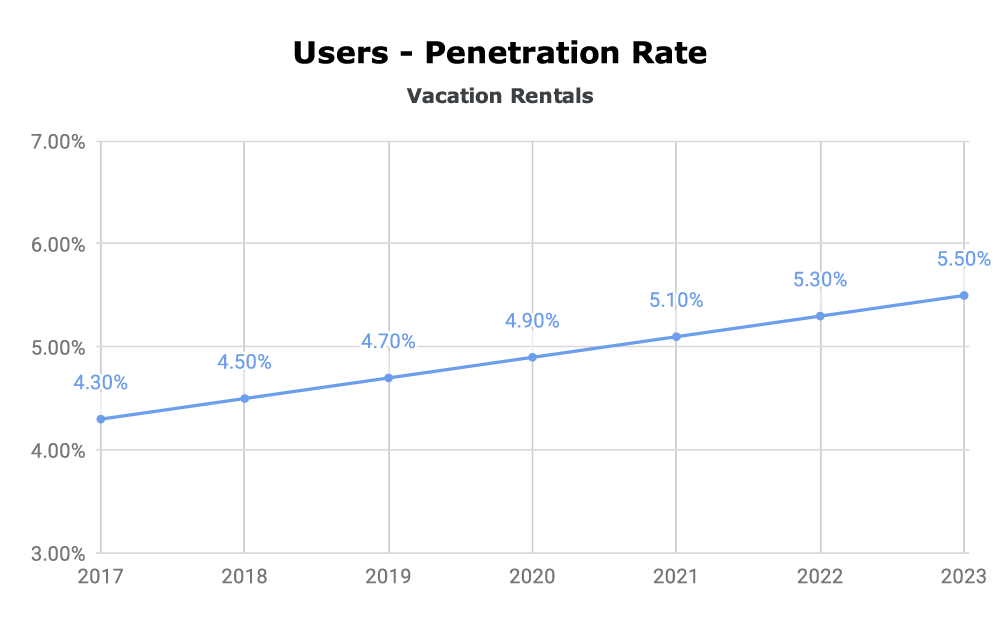
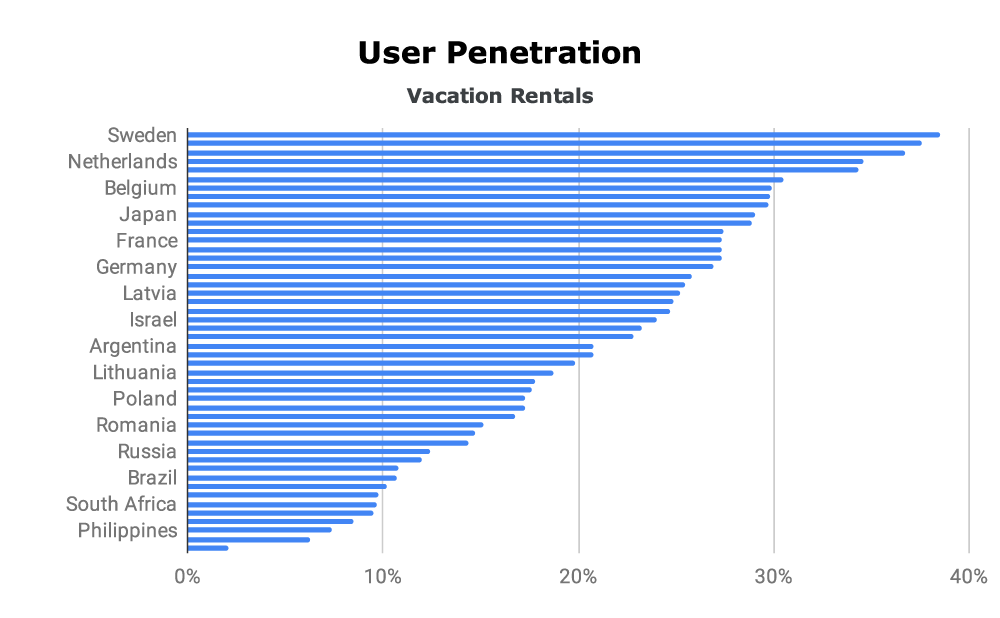
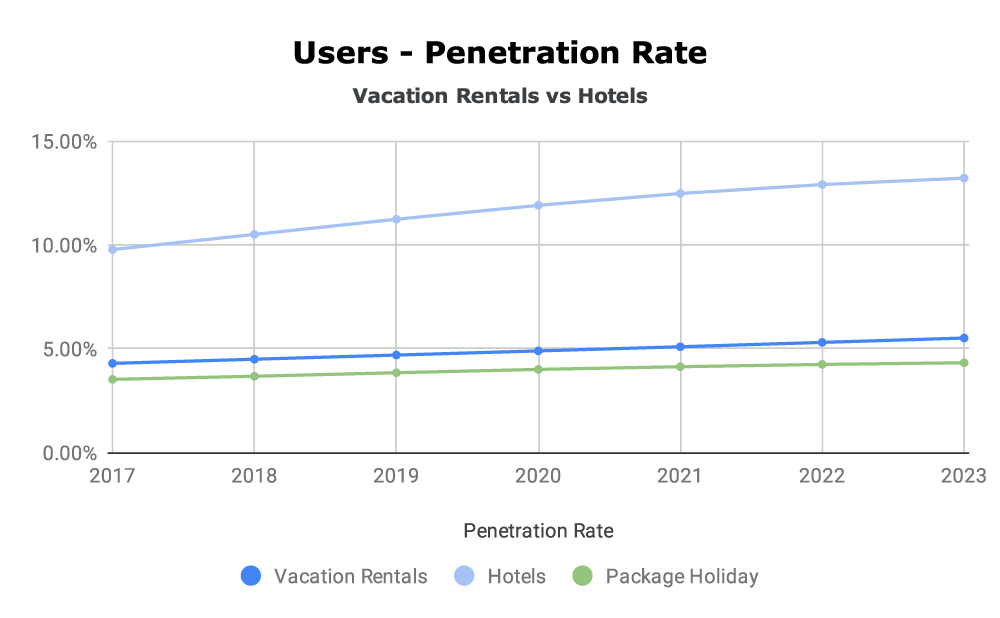
For the unacquainted, user penetration represents the portion of a population that’s familiar with / has used a particular product. In this case, we are seeing the overall penetration of countries with available data.
More global info is included just below..
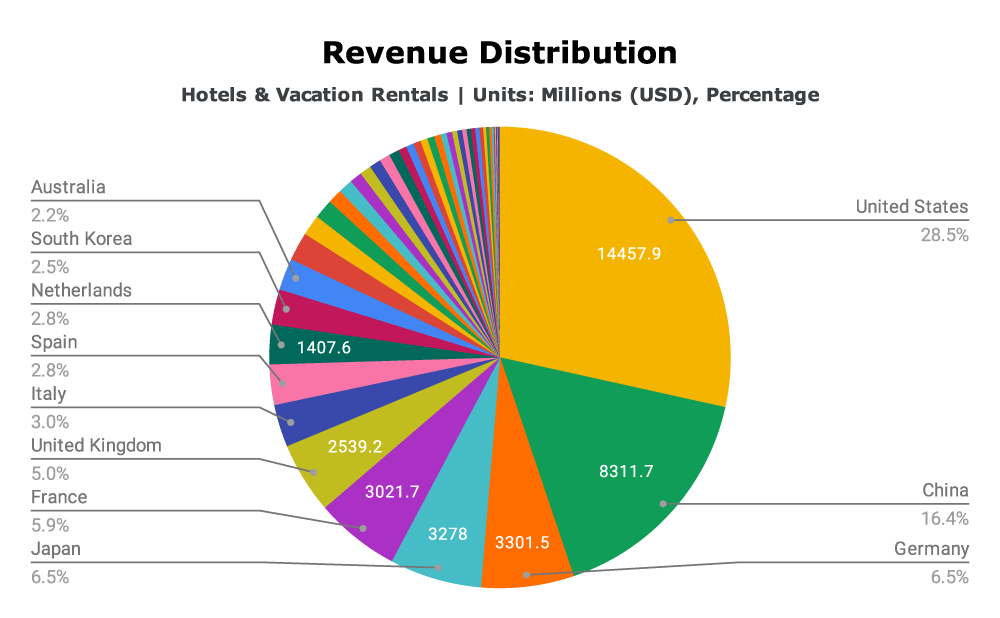
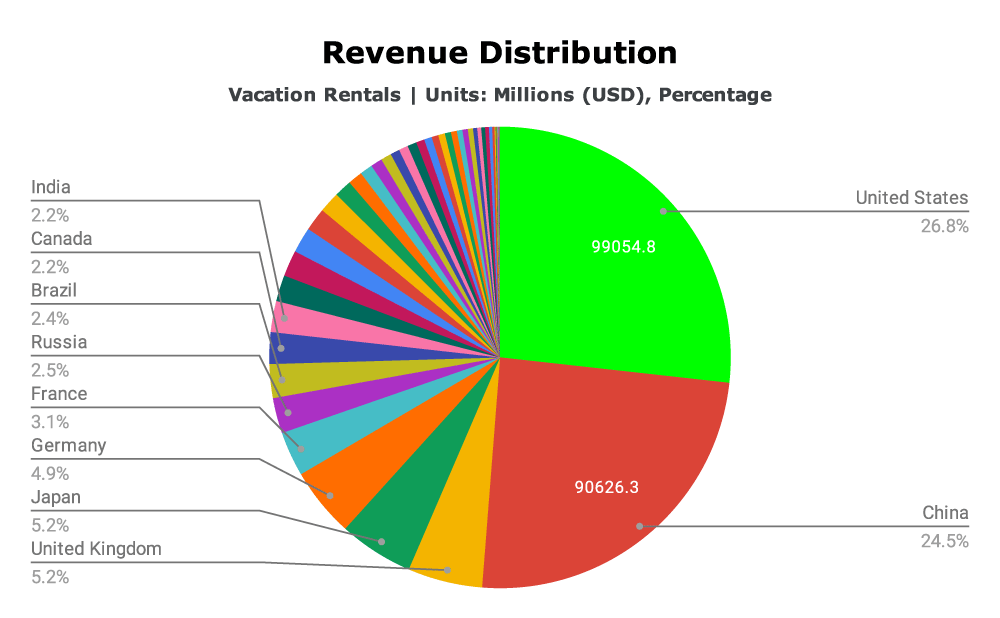
Global Data (Vacation Rentals)
Vacation Rentals vs Hotel Industry
We can talk about vacation rental industry trends without getting into the hotel industry’s performance too. The reason for this is because the VR industry’s growing user base is, for the most part, a direct loss for the hotel industry.
By comparing trendlines for both, we can get a better picture of just how steadfast the vacation rental stands against its only competitor. We can also compare growth to overall market trends, since these two industries represent the entire hotel market.
Revenue (VR + Hotel Industry)
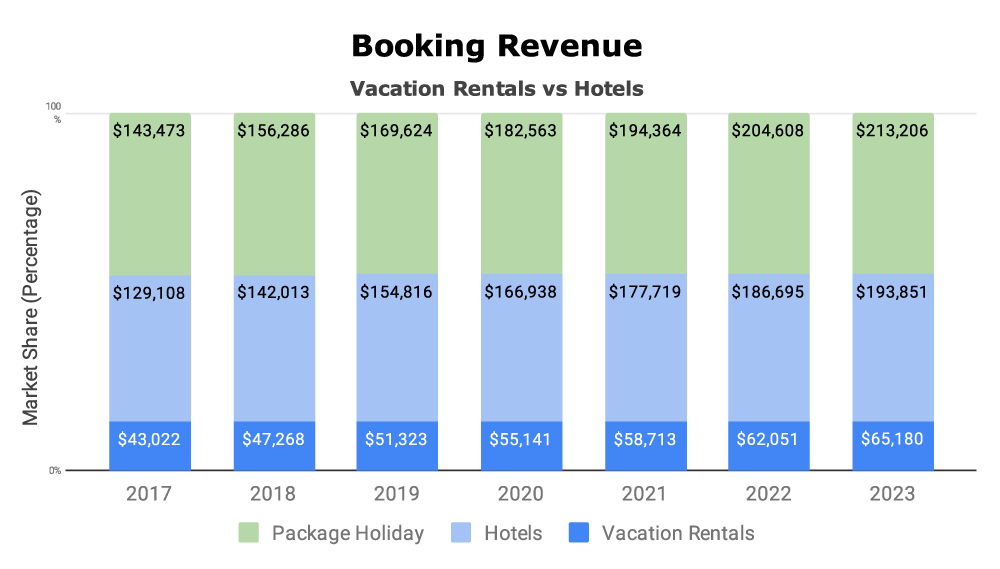
As you may have expected, the hotel industry has a much greater market share. Trend lines for both industries are too close to make any dramatic conclusions. Just two years ago, VRMB was reporting that the hotel industry will collapse by 2020.
Their data that takes in a number of factors we don’t see here in these projections, but it was a pretty big conclusion to jump to. It’d be interesting to know how their predictions may have changed in this short time now that the growth is slowing.
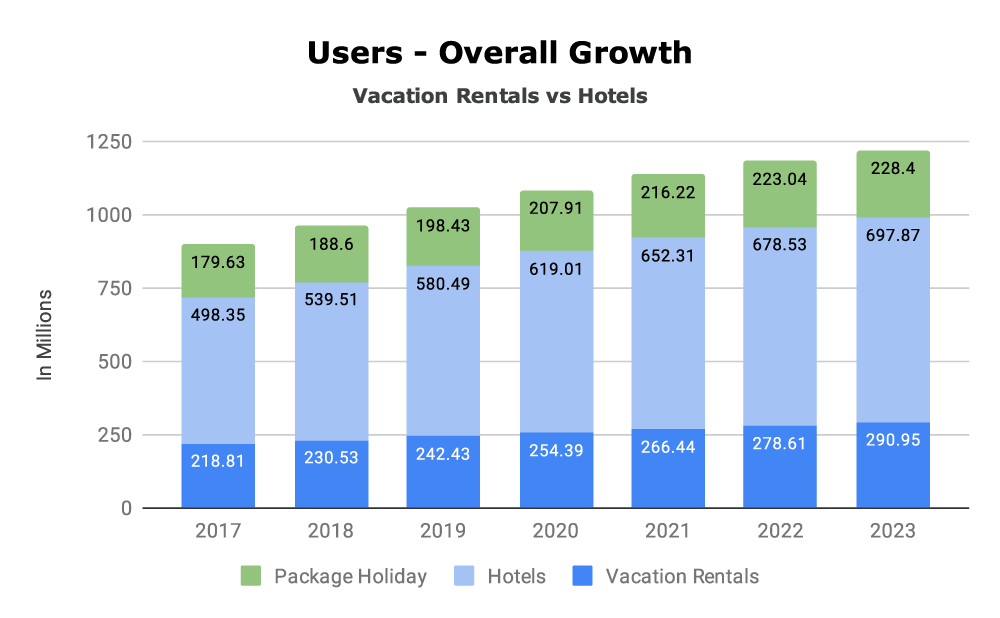
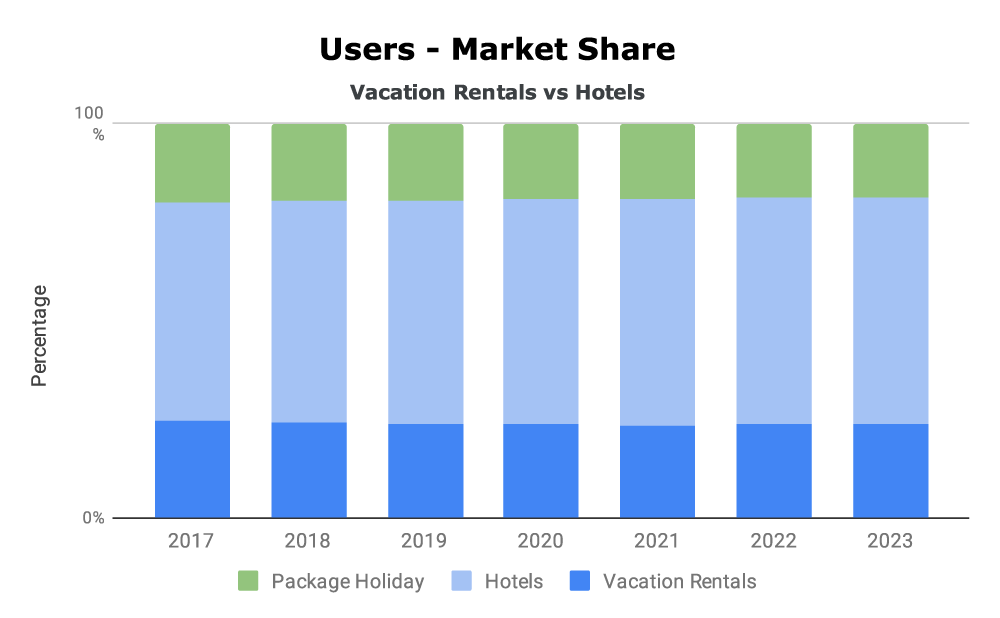
Users (VR + Hotel Industry)
User base increases are virtually deadlocked in comparison. If there’s any conclusion to draw from this, it’s that there’s enough business to be made for both industries to thrive.
Global Data (VR + Hotel Industry)